2012-07-27 by Stefan Urbanek
UPDATE: Added info about caching.
First time I looked at Pandas (python data
analysis framework) I thought: that would be great backend/computation engine
for data Brewery.
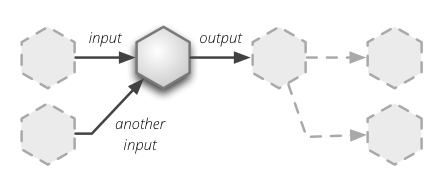
To recap core principle of Brewery: it is flow based data streaming framework
with processing nodes connected by pipes. A typical node can have one or
multiple inputs and has output. Source nodes have no inputs, target nodes have
no outputs.
Current brewery implementation uses one thread per node (was written in times
when Python was new to me and I did not know about GIL and stuff). Can be
considered just as prototype...
Had this idea in mind for quite a some time, however coming
from database world, the only potential implementation was through database
tables with nodes performing SQL operations on them. I was not happy by
requirement of some SQL DB server for data processing, not mentioning speed
and function set (well, ok, pandas is missing the non-numeric stuff).
Here is the draft of the idea, how to implement data transfer between nodes
in Brewery using tables. The requirements are
- follow data modeller's workflow
- do not rewrite data – I want to be able to see what was the result at each step
- have some kind of provenance (where this field comes from?)
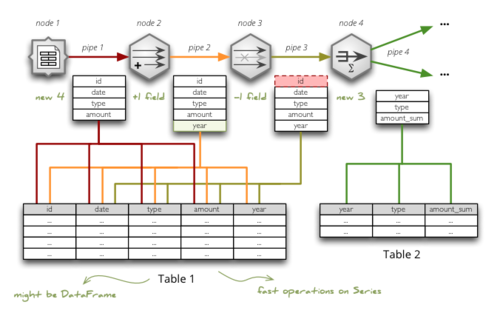
See larger image on imgur.
Table represents a pipe: each pipe field is mapped to a table column. If node performs only field operation, then table can be shared between nodes. If node affects rows, then new table should be considered. Every "pipe" can be cached and stream can be run from the cached point, if the computation takes longer time than desired during model development process.
Pandas offers structure called DataFrame, which holds data in a tabular form consisting
of series of Series (fancier array objects). Each of the series
represents a collection of field's values for analytical/computational step.
Nodes that share same field structure and same records can share the series
which can be grouped in a table/DataFrame.
Node can:
- create completely new field structure (source node, aggregation, join, ...)
- add a field (various derive/compute nodes)
- remove a field (field filter, field replacement)
Just adding or removing a field does not affect the series, therefore nodes
can just point to series they "need". Aggregation or join nodes generate not
only new field structure, they affect number and representation of records as
well, therefore the field series differ form their respective source series
(compare: "year" in invoices and "year" in summary of invoices). For those
kind of nodes new table/DataFrame should be created.
Sampling nodes or selection nodes can generate additional Series with boolean
values based on selection. Each node can have hidden input column representing
the selection.
There are couple of things I am missing so far: DataFrame that will be a "view"
of another data frame – that is: DataFrame will not copy series, only reference them. Another feature is more custom metadata for a table column (DataFrame series), including "analytical datatype" (I will write about this later as it is not crucial in this case). They might be there, I just
did not discovered them yet.
I am not an expert in Pandas, I have just started exploring the framework. Looks
very promising for this kind of problem.
2012-06-12 by Stefan Urbanek
Cubes is going to EuroPython 2012.
EDIT: Added "Need help?".

There are going to be two sessions. First there will be talk introducing to light-weight OLAP with Cubes and Slicer, on Friday at 9:45 in room Tagliatelle (add to calendar). Afterwards there will be longer, more in-depth and hands-on training about Slicing and Dicing with Cubes on Friday at 14:30 in room Pizza Napoli (add to calendar)
In the talk I will introduce the framework and explain reasons for it's existence. Then I will dig into architecture, features and briefly show examples how to use it for slicing and dicing. Newbies are welcome.
The training will go into more details and the participants will learn:
- how to prepare data for aggregated browsing - star and snowflake schemas
- how to create a logical model, define cubes, dimensions and hierarchies
- how to browse aggregated data and how to slice and dice cubes from within
Python
- how to create a WSGI OLAP server ("in 15 minutes" style) for aggregated data
browsing and how to use it in your web application for providing (browsable)
data to end-user reports
- how to provide localized reporting
If the time permits, we can look at the anatomy of the framework and see how
to implement a backend for another kind of data store.
I will be focusing on the existing SQL (relational OLAP) backend.
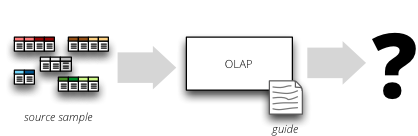
Customized examples
You might use the training session (and not only the session) to solve your
problem - just bring your own sample data, if you like.
Do you have any data that you would like to slice and dice? Have a database
schema and do not know how to create a logical model? You can send me a data
sample or a schema, so I can prepare examples based on problem you are
solving.
Please, do not send any confidential data or schemas under NDA.
Need help?
If you have any questions or would like to help with your data: from data
preparation, through data modeling to slicing and dicing. You can grab me
during the whole event. If you can not find me, just tweet me:
@Stiivi.
Participation
If anyone is interested in participating in the project, he is welcome. Here are some features that are either out of scope of my skills and I would like to cooperate with someone more professional, or I do not have available resources to do that:
I am also very open to new feature suggestions and feature change requests.
Just little note: Cubes is meant to be small and simple. At least for now.
There are plenty of complex and feature-rich solutions out there. If we can
make new, more complex features as non-critical, optional plug-ins, that would
be great.
Links and Calendar Events
You can add the talks to your calendar by following the links:
2012-06-01 by Stefan Urbanek
"We are missing data literacy" was mentioned by Tim Berners-Lee at Open
Government Data Camp 2010 in London. Here we are in 2012 in Berlin, together
with OKFN, P2PU and their friends
preparing content of School of Data from the very
beginning.
Based on our lively discussions lead by Rufus Pollock, reviews by Peter
Murray-Rust and Friedrich Lindenberg, I've created the the pipeline based
skill map that I will talk about here.
The Pipeline
Data have many forms, from ore-like solid (think of web and documents),
crystalized solid (think of databases), through flowing liquid (think of those
being processed) to vaporing gas (think of paying no attention). The best way
of looking at the data is to look at them in all their stages as they go
through a connected, but dismantle-able processing pipeline:
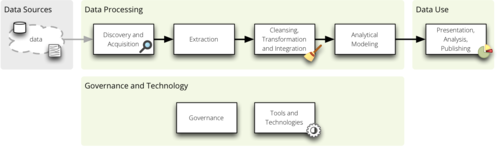
The flow is divided into the following parts:
- discovery and acquisition – covers data source understanding, ways of
getting data from the web and knowing when we have gathered enough
- extraction – when data has to be scraped from unstructured documents into
structured tables, loaded from a tabular file into a database
- cleansing, transformation and integration – majority of skills for data
processing, from understanding data formats, through knowing how to merge
multiple sources to process optimization
- analytical modeling – changing data to be viewed from analytical point of
view, finding various patterns
- presentation, analysis and publishing – mostly non-technical or just very
slightly technical skills for story tellers, investigators, publishers and
decision makers
There are two more side-pipes:
- governance – making sure that everything goes well, that process is
understandable and that content is according to expectations
- tools and technologies – from SQL to Python (or other) frameworks
Here is the full map:
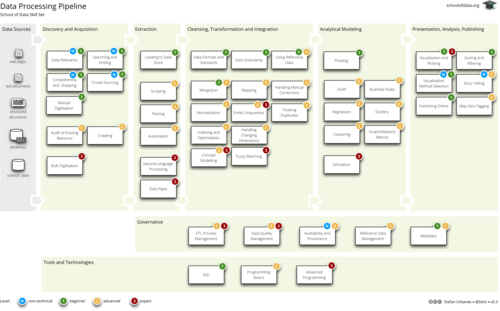
Download the PNG image
or PDF.
Modules or skills
The pipeline skills, or rather modules, are based mostly on experience from
projects in the open-data domain with inspiration of best practices from
corporate environment.
We tried to cover most of the necessary knowledge and concepts so potential
data users would be able to dive-in to their problem and get some reasonable
(sometimes even partial) result at any stage of the pipe. Some of the
corporate best practices are too mature at this moment to be included, some of
them were tuned either with different semantics, different grouping. It was
done intentionally.
Most of the modules will be based on hands-on problem-solving. They will
provide source dataset (or bunch of unknown sources, for the purpose of
discovery), sandbox or a playground environment, and few questions to be
answered. Learner will try to solve the problem using guiding lecture notes.
In ideal module, the dataset would be from existing open-data project, so the
learner would be able to see the big picture as well.
Next Steps
Outline in a form of a pipeline is nice and fine ... as a guideline. Content
has to follow and content will follow. If you would like be involved, visit
the School of Data website. Follow
@SchoolofData on Twitter.
Questions? Comments? Ideas?
Links:
2012-05-29 by Stefan Urbanek
The new minor release of Cubes – light-weight Python
OLAP framework –
brings range cuts,
denormalization
with the slicer tool and cells in /report query, together with fixes and
important changes.
See the second part of this post for the full list.
Range Cuts
Range cuts were implemented in the SQL Star Browser. They are used as follows:
Python:
cut = RangeCut("date", [2010], [2012,5,10])
cut_hi = RangeCut("date", None, [2012,5,10])
cut_low = RangeCut("date", [2010], None)
To specify a range in slicer server where keys are sortable:
    http://localhost:5000/aggregate?cut=date:2004-2005
    http://localhost:5000/aggregate?cut=date:2004,2-2005,5,1
Open ranges:
    http://localhost:5000/aggregate?cut=date:2010-
    http://localhost:5000/aggregate?cut=date:2004,1,1-
    http://localhost:5000/aggregate?cut=date:-2005,5,10
    http://localhost:5000/aggregate?cut=date:-2012,5
Denormalization with slicer Tool
Now it is possible to denormalize tour data with the slicer tool. You do not
have to denormalize using python script. Data are denormalized in a way how
denormalized browser would expect them to be. You can tune the process using
command line switches, if you do not like the defaults.
Denormalize all cubes in the model:
$ slicer denormalize slicer.ini
Denormalize only one cube::
$ slicer denormalize -c contracts slicer.ini
Create materialized denormalized view with indexes::
$ slicer denormalize --materialize --index slicer.ini
Example slicer.ini:
[workspace]
denormalized_view_prefix = mft_
denormalized_view_schema = denorm_views

# This switch is used by the browser:
use_denormalization = yes
For more information see Cubes slicer tool documentation
Cells in Report
Use cell to specify all cuts (type can be range, point or set):
{
    "cell": [
        {
            "dimension": "date",
            "type": "range",
            "from": [2010,9],
            "to": [2011,9]
        }
    ],
    "queries": {
        "report": {
            "query": "aggregate",
            "drilldown": {"date":"year"}
        }
    }
}
For more information see the slicer server
documentation.
New Features
- cut_from_string(): added parsing of range and set cuts from string;
introduced requirement for key format: Keys should now have format
"alphanumeric character or underscore" if they are going to be converted to
strings (for example when using slicer HTTP server)
- cut_from_dict(): create a cut (of appropriate class) from a dictionary
description
- Dimension.attribute(name): get attribute instance from name
- added exceptions: CubesError, ModelInconsistencyError, NoSuchDimensionError,
NoSuchAttributeError, ArgumentError, MappingError, WorkspaceError and
BrowserError
StarBrowser:
- implemented RangeCut conditions
Slicer Server:
/report JSON now accepts cell with full cell description as dictionary,
overrides URL parameters
Slicer tool:
denormalize option for (bulk) denormalization of cubes (see the the slicer
documentation for more information)
Changes
- important: all
/report JSON requests should now have queries wrapped in the key
queries. This was originally intended way of use, but was not correctly
implemented. A descriptive error message is returned from the server if the
key queries is not present. Despite being rather a bug-fix, it is listed
here as it requires your attention for possible change of your code.
- warn when no backend is specified during slicer context creation
Fixes
- Better handling of missing optional packages, also fixes #57 (now works
without slqalchemy and without werkzeug as expected)
- see change above about
/report and queries
- push more errors as JSON responses to the requestor, instead of just failing
with an exception
Links
Sources can be found on github.
Read the documentation.
Join the Google Group for discussion, problem solving and announcements.
Submit issues and suggestions on github
IRC channel #databrewery on irc.freenode.net
If you have any questions, comments, requests, do not hesitate to ask.
2012-05-14 by Stefan Urbanek
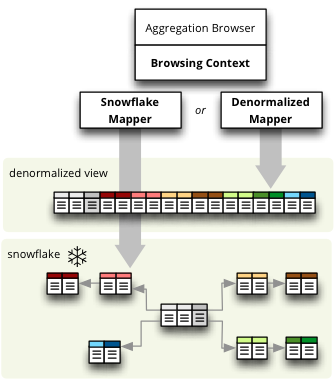
The new version of Cubes – light-weight Python OLAP framework – brings new StarBrowser, which we discussed in previous blog posts:
The new SQL backend is written from scratch, it is much cleaner, transparent, configurable and open for future extensions. Also allows direct browsing of star/snowflake schema without denormalization, therefore you can use Cubes on top of a read-only database. See DenormalizedMapper and SnowflakeMapper for more information.
Just to name a few new features: multiple aggregated computations (min, max,...), cell details, optional/configurable denormalization.
Important Changes
Summary of most important changes that might affect your code:
Slicer: Change all your slicer.ini configuration files to have [workspace]
section instead of old [db] or [backend]. Depreciation warning is issued, will
work if not changed.
Model: Change dimensions in model to be an array instead of a
dictionary. Same with cubes. Old style: "dimensions" = { "date" = ... }
new style: "dimensions" = [ { "name": "date", ... } ]. Will work if not
changed, just be prepared.
Python: Use Dimension.hierarchy() instead of Dimension.default_hierarchy.
New Features
- slicer_context() - new method that holds all relevant information from
configuration. can be reused when creating tools that work in connected
database environment
- added Hierarchy.all_attributes() and .key_attributes()
- Cell.rollup_dim() - rolls up single dimension to a specified level. this might
later replace the Cell.rollup() method
- Cell.drilldown() - drills down the cell
- create_workspace(backend,model, **options) - new top-level method for creating a workspace by specifying backend name. Easier to create browsers (from
possible browser pool) programmatically. The backend name might be full
module name path or relative to the cubes.backends, for example
sql.star for new or sql.browser for old SQL browser.
-
get_backend() - get backend by name
-
AggregationBrowser.cell_details(): New method returning values of attributes
representing the cell. Preliminary implementation, return value might
change.
-
AggregationBrowser.cut_details(): New method returning values of attributes
representing a single cut. Preliminary implementation, return value might
change.
-
Dimension.validate() now checks whether there are duplicate attributes
- Cube.validate() now checks whether there are duplicate measures or details
SQL backend:
- new StarBrowser implemented:
- StarBrowser supports snowflakes or denormalization (optional)
- for snowflake browsing no write permission is required (does not have to
be denormalized)
- new DenormalizedMapper for mapping logical model to denormalized view
- new SnowflakeMapper for mapping logical model to a snowflake schema
- ddl_for_model() - get schema DDL as string for model
- join finder and attribute mapper are now just Mapper - class responsible for
finding appropriate joins and doing logical-to-physical mappings
- coalesce_attribute() - new method for coalescing multiple ways of describing
a physical attribute (just attribute or table+schema+attribute)
- dimension argument was removed from all methods working with attributes
(the dimension is now required attribute property)
- added create_denormalized_view() with options: materialize, create_index,
keys_only
Slicer tool/server:
- slicer ddl - generate schema DDL from model
- slicer test - test configuration and model against database and report list
of issues, if any
- Backend options are now in [workspace], removed configurability of custom
backend section. Warning are issued when old section names [db] and
[backend] are used
- server responds to /details which is a result of
AggregationBrowser.cell_details()
Examples:
- added simple Flask based web example - dimension aggregation browser
Changes
- in Model: dimension and cube dictionary specification during model
initialization is depreciated, list should be used (with explicitly
mentioned attribute "name") -- important
- important: Now all attribute references in the model (dimension
attributes, measures, ...) are required to be instances of Attribute() and
the attribute knows it's dimension
- removed
hierarchy argument from Dimension.all_attributes() and .key_attributes()
- renamed builder to denormalizer
- Dimension.default_hierarchy is now depreciated in favor of
Dimension.hierarchy() which now accepts no arguments or argument None -
returning default hierarchy in those two cases
- metadata are now reused for each browser within one workspace - speed
improvement.
Fixes
- Slicer version should be same version as Cubes: Original intention was to
have separate server, therefore it had its own versioning. Now there is no
reason for separate version, moreover it can introduce confusion.
- Proper use of database schema in the Mapper
Links
Sources can be found on github.
Read the documentation.
Join the Google Group for discussion, problem solving and announcements.
Submit issues and suggestions on github
IRC channel #databrewery on irc.freenode.net
If you have any questions, comments, requests, do not hesitate to ask.